
Breaking the Language Barrier: WeRobotics Partners with Beluga Linguistics...
April 23, 2024
With language localization, the Flying Labs Network will now step into a more interconnected and inclusive future.
June 19th, 2018

Guest blog post by University of Pennsylvania School of Engineering students Nadia Kreciglowa, Anurag Makineni, Thomas Mulroy, Shreetej Reddy, George Sun and Brian Zhang. Editor's note: the first generation prototype autonomous cargo boat designed, built and tested by the UPenn team is being shipped to our Panama Flying Labs for further testing and improvements. Our Panama Flying Labs team is keen to field test the use of this autonomous platform to provide medical supplies to remote indigenous communities.
We’re a group of six students at the University of Pennsylvania studying mechanical engineering who are passionate about humanitarian robotics, and for our senior design capstone, we formed team ArchipelaGO, small scale humanitarian delivery on demand. Our previous blog post detailed the need, background, and design requirements of this project, so this blog will go into a summary of our accomplishments this past academic year.
One of the key parameters our autonomous vessel needed to meet was stability and making sure that it would not flip on the ocean. We decided to create a more traditional surface vessel instead of a more exotic design such as a self-righting hull or submersible because such designs are very complex, and we thought that a better utilization of resources lay in maximizing stability. We determined that catamarans are more stable than monohulls, but the stability of our vehicle specifically had to be analyzed in order to ensure that the boat could survive the waves present in the region. When determining the stability of a boat, the center of buoyancy and the center of gravity are necessary (Figure: 1). In the figure below, the red arrow pointing up is the center of buoyancy, while the black arrow pointing down is the center of gravity.
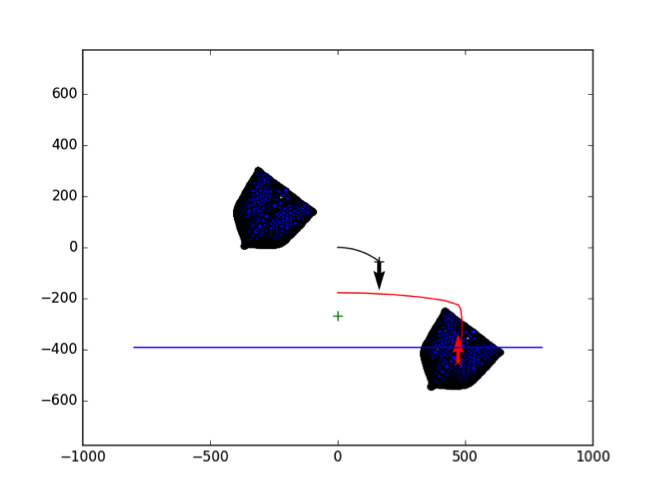
Figure 1: Hull Stability Analysis
Thus, the angle necessary for stability was determined, and we had to test whether this holds true with our vehicle. This is determined by analyzing the center of gravity and the center of buoyancy in simulation (Figure 2). When the center of gravity is to the left of the center of buoyancy, the boat has a positive righting moment, but as soon as the center of buoyancy crosses the center of gravity (goes to the right of), then the righting moment is negative. We created a Python script that takes a 3D CAD model of our hulls as an input. It then iteratively calculates the center of buoyancy and center of gravity for a range of angles to determine the overall stability of the vessel. The output of the script is the righting moment as a function of roll angle as seen in Figure 2. It is clear that the catamaran has positive stability until an angle of 78.
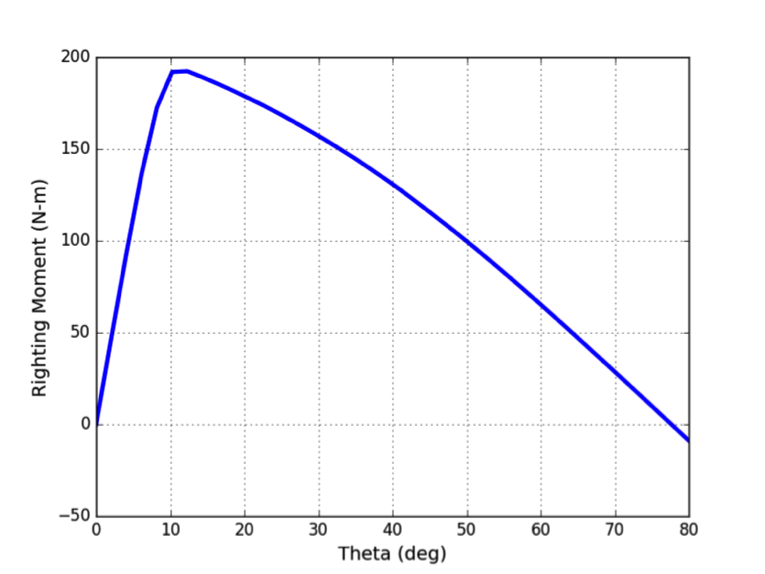
Figure 2: Stability Angle
From our hull selection, we chose the most stable catamaran hull shape from textbook data and used scaling laws to determine the final hull characteristics, principally the hull resistance, which is the force needed to propel the vessel at a certain speed. The shape of the hull may be seen in Figure 3. We used fiberglass and epoxy overlayed on a foam substrate to construct the hulls because they are light and very strong.
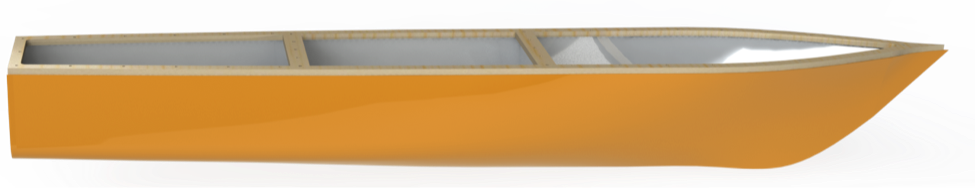
Figure 3: Hull Render
Using our hull resistance data, we were able to calculate the needed effective horsepower to propel our vessel at our target cruise speed (3 m/s) for our target range (30 km) as well as the amount of battery energy needed. We decided to use a Lithium Polymer battery-electric propulsion system because we were able to successfully mass-budget the mass of the batteries, it does not rely on fuel infrastructure, and a battery-electric propulsion allows the utilization of differential thrust for directional controls.
Our final system form can be seen in Figure 4 and consists of a vertical stack of fiberglass hull, ABS flange for a flat horizontal surface, rubber gasket for sealing, and clear acrylic access panel secured by O-rings and screws. The central panels are latched, allowing easy swapping access to the lithium polymer batteries powering the propellers. The central bridge consists of an aluminum frame, epoxied plywood surface, fiberglass medicine storage, and rear electronics compartment.
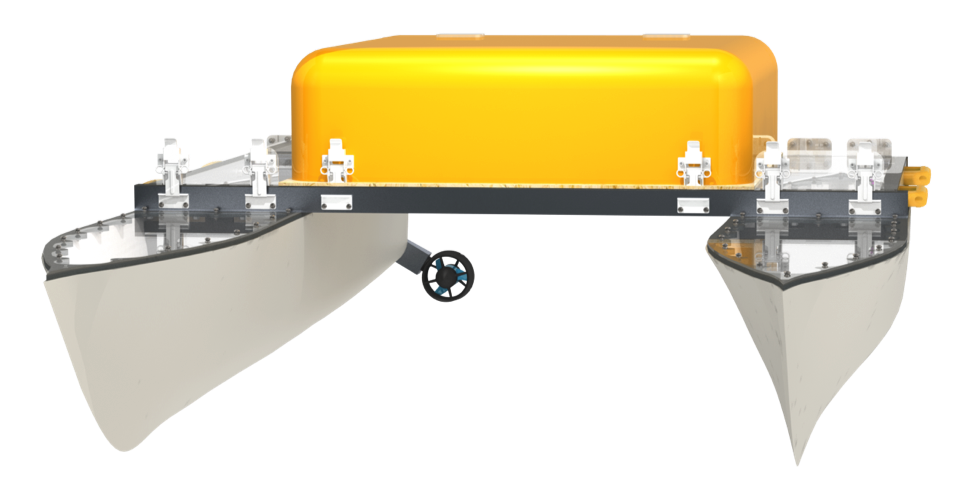
Figure 4: Final System Form
The electronics system can be broken into three major components, low level actuation and sensing, computation, and off-board monitoring. The architecture of the electronics system can be seen in the system diagram (Figure 5).
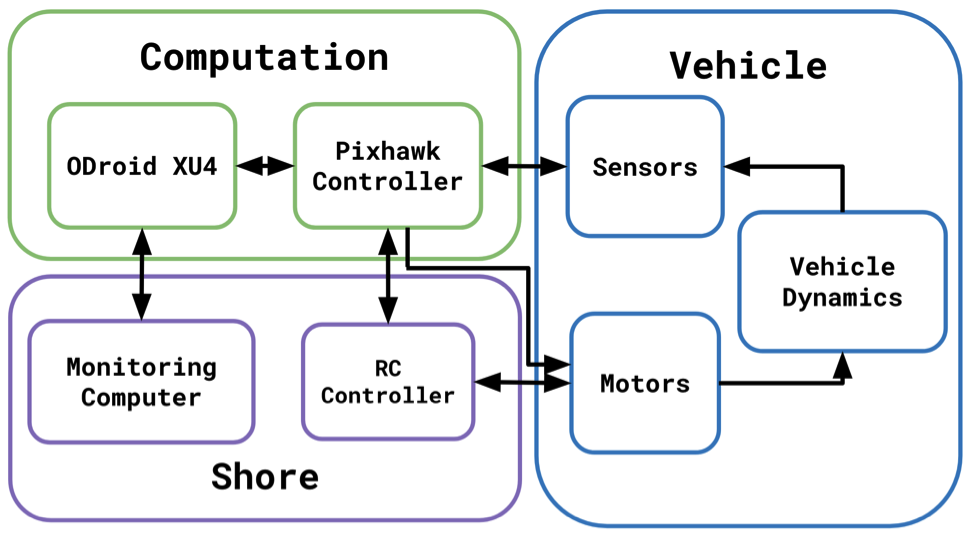
Figure 5: Electronics System Architecture
The low-level system consists of sensors and interfaces to control our actuators. The vessel has a Global Position System (GPS) receiver to determine position and an Inertial Measurement Unit (IMU) to measure angular rates and linear accelerations. The raw sensor data is sent to the Pixhawk Microcontroller where the information is fused by an Extended Kalman Filter (EKF) to combine the IMU and GPS readings into a position and orientation estimate. The vehicle also has two sensorless brushless electronic speed controllers to govern the speed of our thrusters. The Pixhawk Microcontroller is able to send motor speed setpoints via a Pulse Width Modulation (PWM) signal to the speed controller.
The computation on the vehicle consists of the Pixhawk Microcontroller and the ODroid XU4 computer. The Pixhawk handles the low-level communication between to the sensors and speed controllers. It also runs estimators to provide filtered position and orientation estimates to the ODroid. The ODroid is an ARM based computer running Linux. We make use of the Robot Operating System (ROS) library to run our code. The trajectory generator, position controller, and attitude controller all run on the ODroid on top of the ROS middleware.
The ODroid is connected to a 2.4 GHz radio to transmit and receive data with an off-board monitoring computer. Additionally, we employ a 900 MHz Radio Control transmitter and receiver to send manual commands to the vessel. This is used in-case autonomy fails while the vessel is Deployed.
Small scale tests were done in order to compare to data from textbooks. Once the hull shape and size were determined, we scaled them down and 3D printed two hulls. These hulls were attached to a rig and dragged through water at various constant velocities and had a force sensor to measure the total drag (Figure 6). However, these tests returned highly noisy results, that we were unable to analyze with our time constraints. Thus, the textbook data was used to scale the resistance, rather than the small scale hull tests.
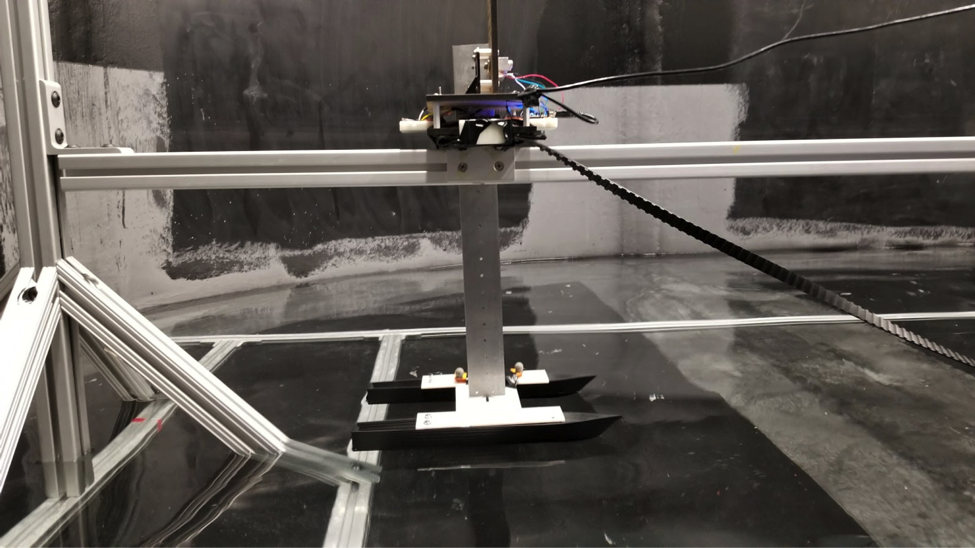
Figure 6: Small Scale Testing Setup
After making the necessary additions to the PX4 firmware on the Pixracer flight controller, the mappings between the RC transmitter and the BlueRobotics thrusters were verified. A small benchtop setup consisting of the motors, electronic speed controllers, Pixracer, RC receiver, and power supply was assembled. With this benchtop setup (Figure 7), the throttle and yaw joysticks on the RC transmitter were manipulated in order to make sure the RC throttle and yaw commands resulted in the expected individual motor thrust magnitudes and directions.
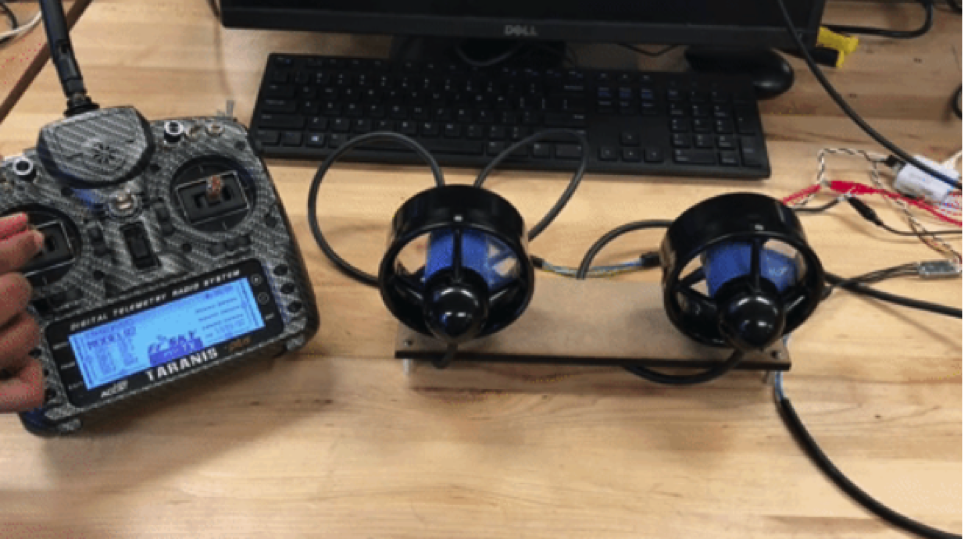
Figure 7: RC Control
To verify the design and performance of our controllers, we used the Gazebo Simulation Environment. The simulator implements the full 6 degree of freedom dynamic model. We include interfaces in our attitude controller to send motor thrust commands to the virtual vessel and receive information from the simulated sensors as if they were on the vehicle. These interfaces allow testing of the control framework completely in simulation. With this framework, the attitude controller was tested and tuned completely in simulation prior to testing in the real world. The simulation is shown in Figure 8.
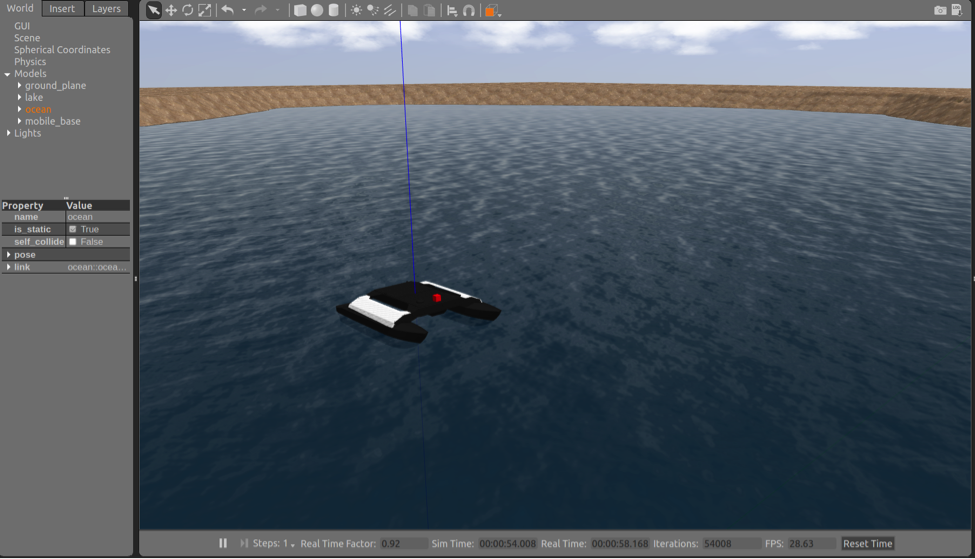
Figure 8: Gazebo Simulation
The first method of integrated testing consisted of deploying the boat in the Biopond, a small still-water pond located on the University of Pennsylvania campus. The main goals for testing in the Biopond were to assess the effectiveness of the catamaran’s waterproofing, ensure the RC functionality, and tune the gains of the attitude controller. The first phase of testing consisted of driving the boat around the Biopond using RC control. During these test drives, the boat was propelled across its full spectrum of forward velocities and yaw velocities. The boat was removed from the Biopond after this first phase of testing, and it was determined after inspection that a small amount of water had leaked into each of the hulls. As a result, another layer of epoxy was placed on the surface of the hulls. The second phase of testing started with driving the boat with RC control, and then consisted of running the offboard attitude controller with yaw angle inputs ranging between 10 and 60 degrees. Through an iterative process, the response of the attitude controller closing the yaw error was visually analyzed and corresponding adjustments to the gains of our controller were made until a satisfactory response was achieved. Lastly, the boat was again checked for signs of water leakage, and no significant signs of water leakage were determined. An example can be seen in Figure 9.
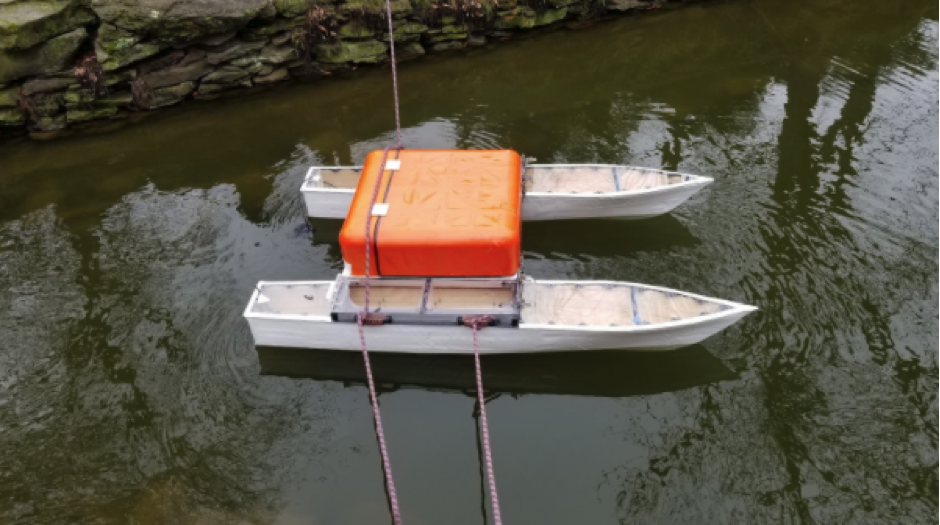
Figure 9: Biopond Testing
Once the vehicle safely traveled on the Penn Biopond, we moved to Schuylkill River tests. These tests consisted of testing our heading controller and trajectory generator, as well as simple RC control. RC control worked without problems, as expected from our prior tests.
We tested our heading control going down river, up river, and across the river (i.e. cross current). All three tests gave quite similar results, with our vehicle being able to follow the desired heading accurately. The most difficult test for the vehicle was the cross current test (Figure 10), but even in this test the error from the desired angle was small (min = −0.61, RMS = 0.6, and max = 1.36).
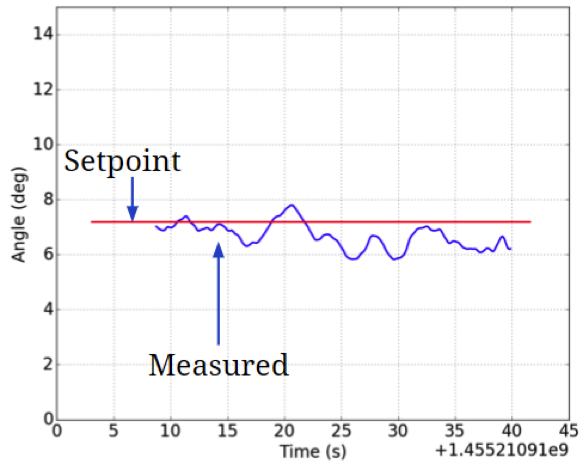
Figure 10: Heading Cross River Test
The maximum velocity of the vehicle was also tested. The desired maximum velocity is 3 m/s. In the Schuylkill, a maximum velocity of 2.88 m/s was reached (Figure 11), which is close to our desired maximum, although a little slower.
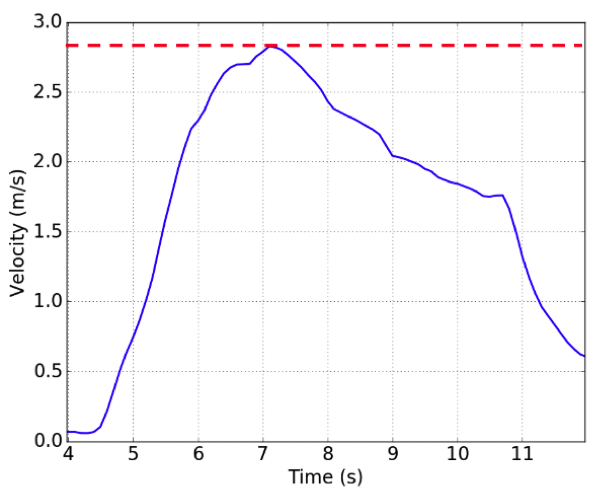
Figure 11: Maximum Velocity Test
This project serves as a successful proof of concept but requires significant design improvements, iterations, and testing to meet the ultimate goal of small scale humanitarian aid delivery in the Philippines and other island nations. While the hull design has been shown to be feasible, such a manufacturing method may not be economically feasible on a larger scale. Alternatives such as purchasing and refitting existing hulls may prove more time efficient, reliable, and mechanically consistent. A much more robust cold storage compartment will need to be designed. Still, this project succeeded in collecting background information about the needs of remote communities. The team developed a simulation environment and empirically demonstrated the feasibility of an battery-electric differential thrust catamaran for this purpose.
We hope to see the project to be further developed so that the overall solution consists of a fleet of these catamaran delivery boats that are able to autonomously transport medicines between different islands or along rivers.
